As a leader today, you count on accurate data to make decisions but how timely is it? Can you get all the data you require to make informed decisions when you need it? Are you often hearing about a problem that has surfaced that could have been prevented? Do you trust the information you are getting from other areas of the business which directly impacts your team and their ability to meet targets?
If you are accountable to make critical strategic decisions that directly impact your business, you’ll need a finger on the pulse of operations to foresee and address challenges, seize opportunities, predict and forecast sales/inventory/labour resources and naturally have a current picture of revenues, expenses, and profit. Having a live dashboard that feeds data from various systems and sources in your business will transform your ability to make key decisions that drive profitability, growth, and long-term success.
In addressing operational issues, timing is critical. Live dashboards allow you to detect, address and resolve problems before they escalate. Continuous monitoring of key metrics and performance indicators allows for efficient resource management and informed decision making to ensure operational efficiency and effectiveness.
Whether it is tracking bottlenecks in a supply chain, identifying delays in a construction project, or spotting inefficiencies on the manufacturing floor, a central hub of real-time data will save both time and money.
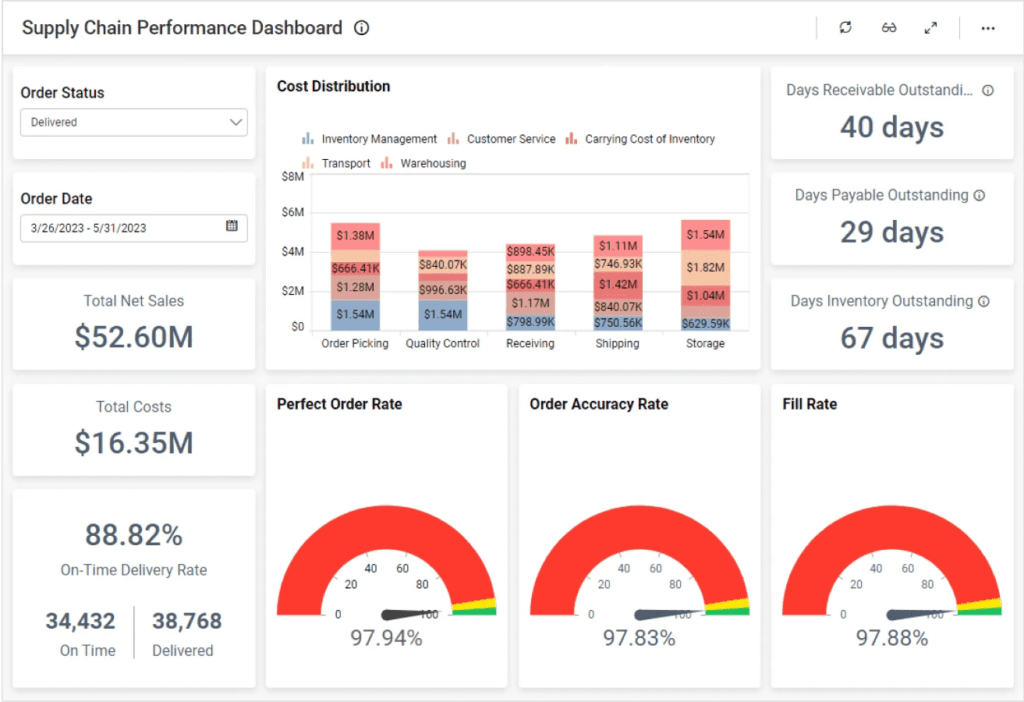
This Supply Chain Dashboard example offers a snapshot of financial performance, highlighting profitability, cost distribution, and operational efficiency metrics. It also provides insights into cash flow management, pinpointing areas like inventory management that could be optimized to improve overall supply chain performance.
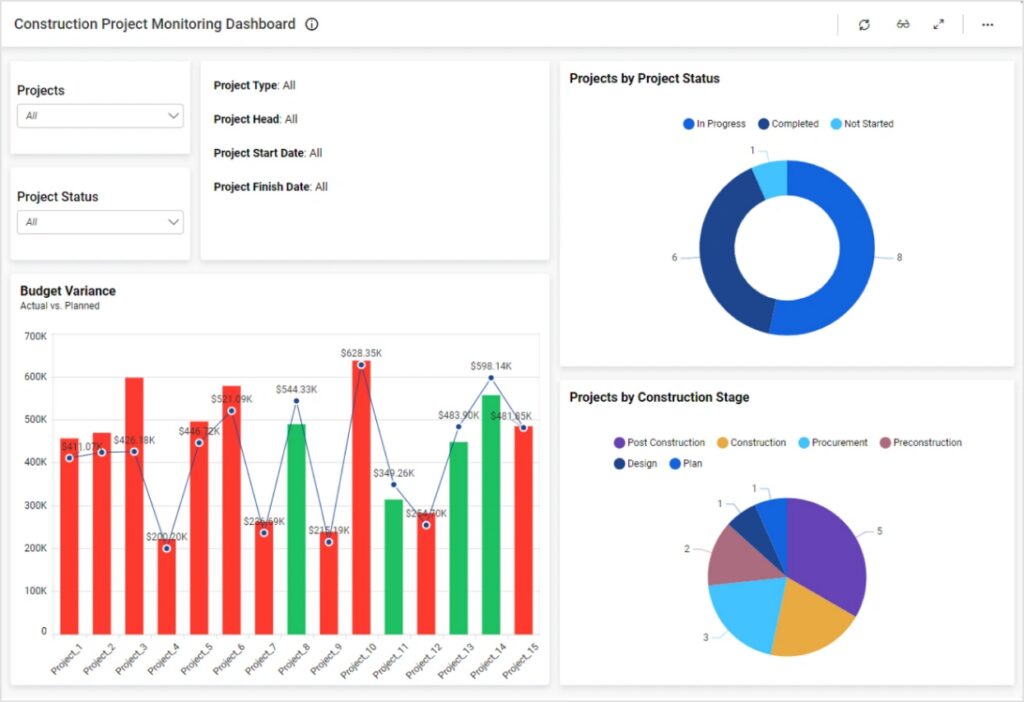
This Construction Dashboard example provides an immediate view of which projects are over budget and which are efficiently managed, enabling us to drill down further to establish the root causes (budgeting, estimating, labour, materials, scheduling or other). This chart also shows the stages of ongoing projects, resource allocation, and where additional resources may be needed.
If you are making high-stakes decisions that require foresight a live dashboard can not only provide current insights but also tracks historical trends. This historical context helps you to understand how past events influence current conditions and may contribute to future forecasts.
In the financial industry, historical dashboards allow leaders to analyze revenue growth, customer behavior, and financial health over time. This kind of insight supports better forecasting and long-term decision-making, offering a clear picture of where the business has been and where it can go next.
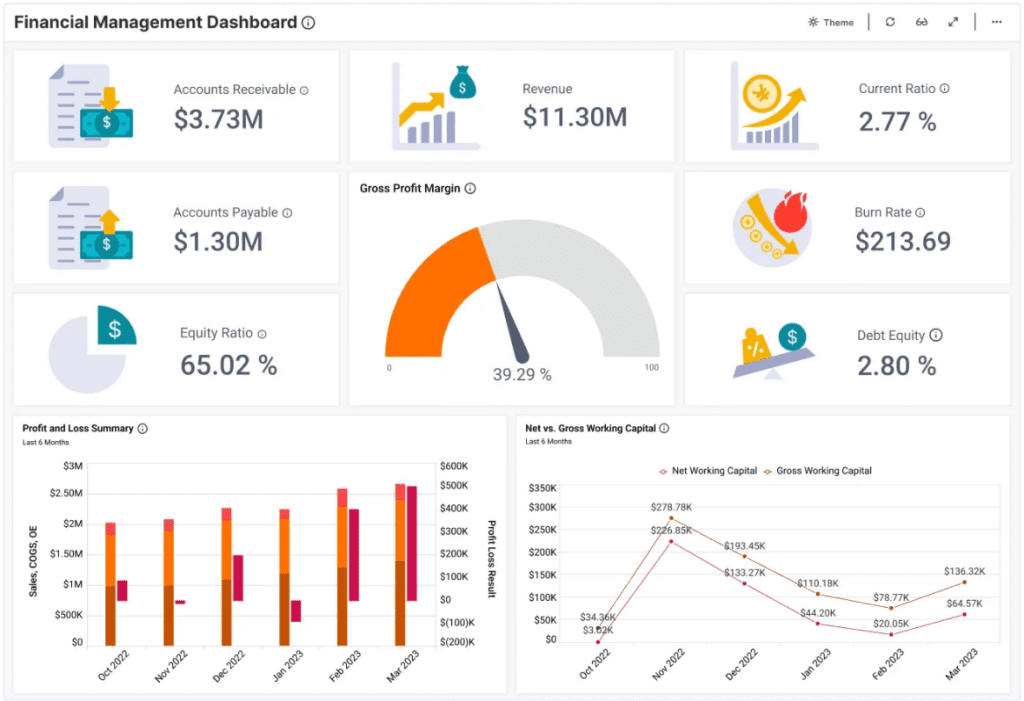
In our Financial Management Dashboard example, we can see a clear overview of financial health, pinpointing areas for improving profitability, optimizing cash flow, and addressing potential liquidity challenges. It offers actionable insights into cost management, pricing strategies, and long-term financial sustainability.
Beyond problem-solving, live dashboards are also key to identifying new growth opportunities by providing a comprehensive view of operations and metrics to recognize patterns and opportunities that might not be evident from traditional reporting methods. These insights can actively support business expansion allowing you to act quickly to capitalize on emerging trends.
In retail, real-time sales and customer engagement metrics can reveal emerging trends in consumer preferences across different channels, enabling businesses to quickly adapt their product offerings for increased sales.
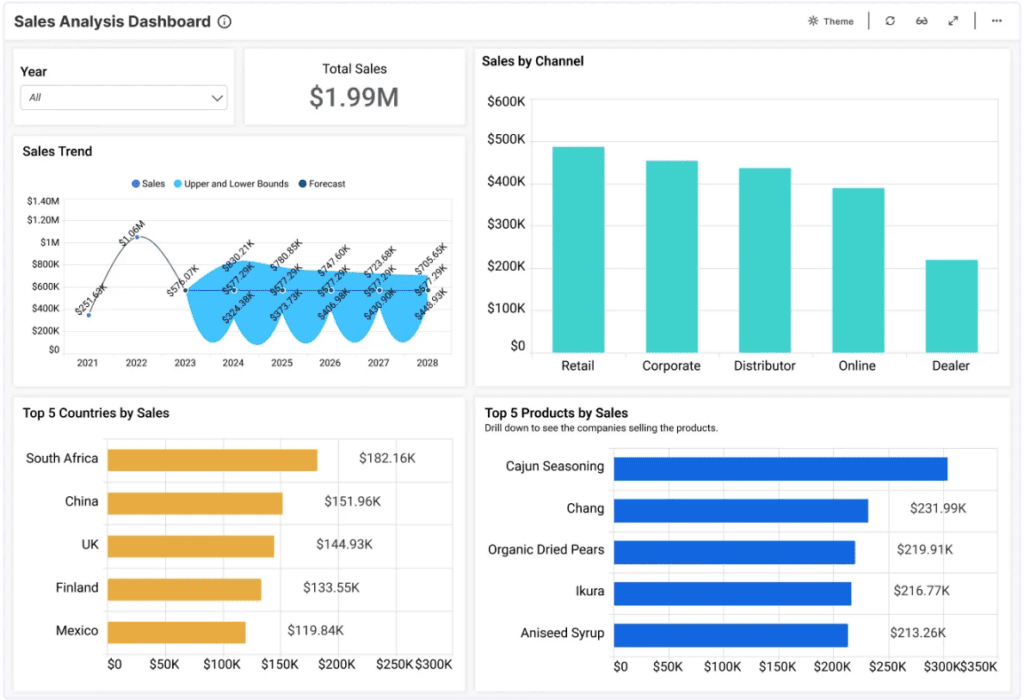
For example, in the Sales Analysis Dashboard, we can see a clear overview of sales performance across various channels, pinpointing trends and variances. It highlights yearly sales trends, top countries by sales and top products by sales. This offers actionable insights into performance variations across channels, countries and products aiding in the analysis of evolving sales patterns and customer preferences
Change is the norm for business today and therefore you cannot wait for monthly reports to make your next decisions. Live data isn’t just an advantage — it is a strategic imperative. Is it time to unlock the potential opportunities and make better decisions?
As a reputable business consulting services firm with 2 decades of experience solving complex business challenges and creating transformative change, you can rely on our technology consulting professionals to work with you to build a tailored dashboard that will allow you to be agile, responsive and able to capitalize on the historical data, current state data and the predictive insights that will make for better informed decisions to propel your business forward.